Our new SpotOn Verify 2.5 software explained plain and simple using a real customer and their printers!
Bonnie and Clyde, two identical inkjet printers, were originally calibrated to match the GRACoL specification as proofers. Over many months they drifted from the GRACoL target, as inkjet printers will do over time. After some time, the two printers were no longer printing the same. It was quite noticeable that they looked different when printing the same file on both printers.
We printed an IDEAlliance ISO12647-7 Control Wedge 2013 on both printers and found they both passed an IDEAlliance verification for G7 Colorspace tolerances.


There were differences in the ∆E values, but in essence they both passed. This is a common occurrence where multiple proofs look different but still pass industry tolerances.
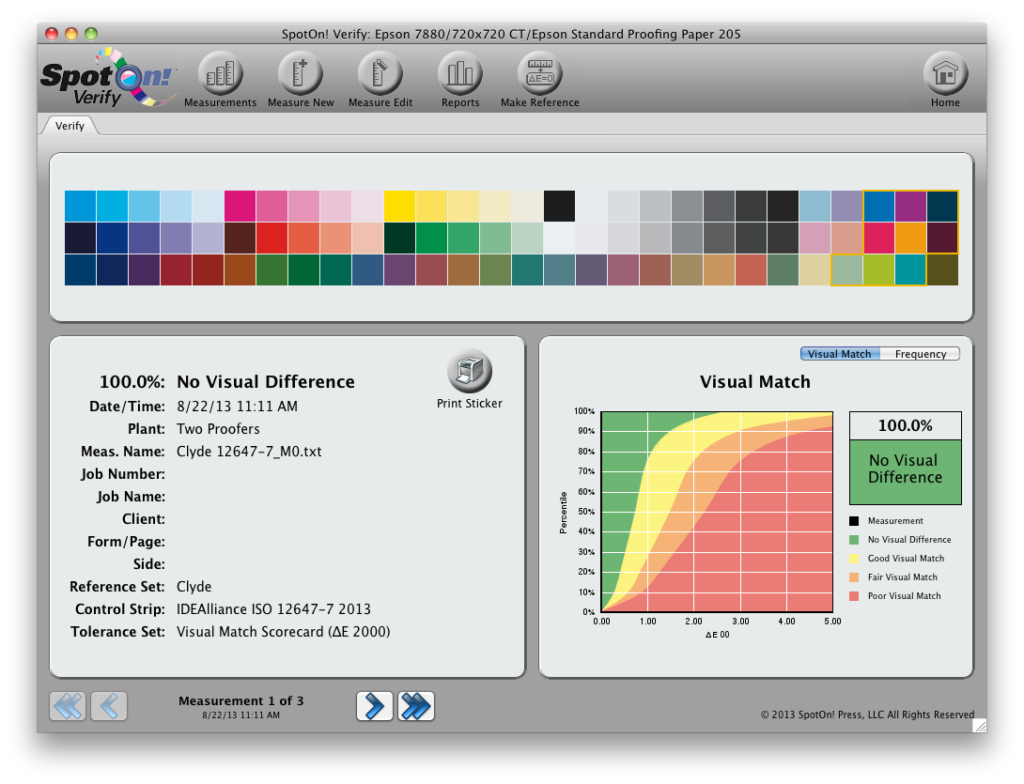
After much research and testing we have developed a scoring system that bases the score on a non-arbitrary formula for statistical probability. This means there are no settings the user can change to affect the score, and the score is based on the probability of a good or poor match. Taking the very same data and changing the Tolerance Set to Visual Match gave us these results.


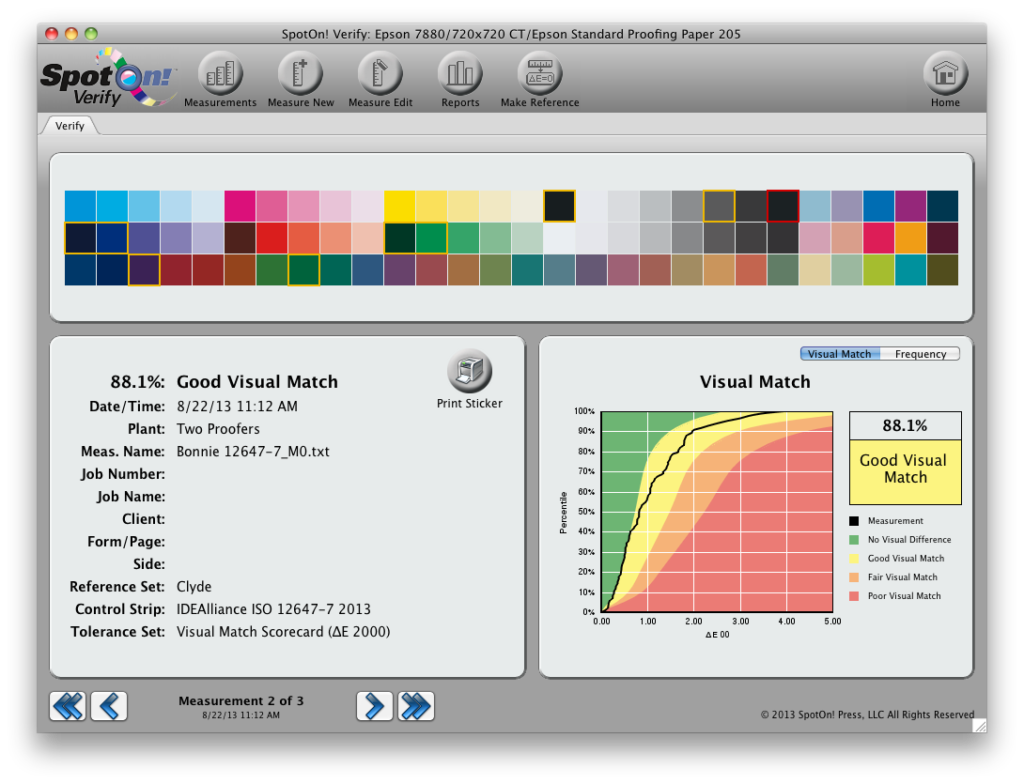
We have clearly different results that more closely resemble what we were seeing in the two prints. Clyde was the closest and fell into the No Visual Difference zone, while Bonnie was a bit worse and fell into the Good Visual Match zone. Mind you, the two prints were not that far off and these graphs show there was only about a 4% difference between the two. The important point being that the Visual Match Scorecard did indicate the difference and the Pass/Fail industry tolerances did not.
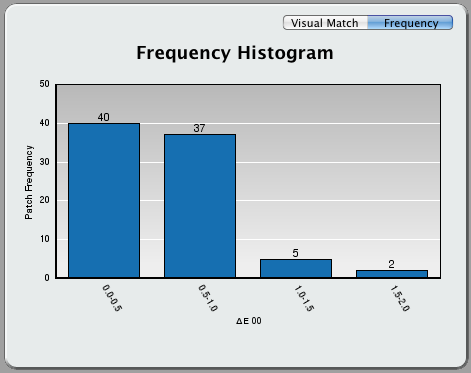
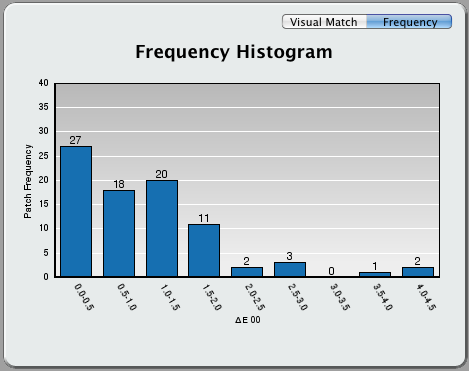
Further examination shows that Clyde printed 77 out of 84 patches less than 1.0 ∆E00, a pretty good probability of a very tight match. Bonnie only printed 45 out of 84 patches less than 1.0 ∆E00, a bit less probability of a tight match, but not a bad match.
Since the customer wanted to see the difference between Bonnie and Clyde we made Clyde the Reference, replacing GRACoL 2006 as the Reference.
This shows Clyde measured to itself (100%) and Bonnie measured to Clyde, which has a slightly lower score than Bonnie measured to GRACoL. So if we are comparing Bonnie to Clyde, we are accurately showing the Visual Match Score between the two printers.

We recalibrated and optimized Bonnie to the GRACoL spec and here are the results as compared to Clyde.
The two printers are now printing with no visual difference between them and the customer is happy with the results.
Click here to find out more about Spoton! Verify 2.5
Leave a Reply